B2B
Web App
Revamp
UX Research
Fuello - Fuel Site and Forecourt Management
Running a fuel retail network means fuel prices, cash takings, tank stock, and supplier costs are all changing constantly across every site. Fuello replaces a patchwork of spreadsheets and disconnected tools with a single dashboard, giving site managers, area managers, and head office finance one connected view of pricing, sales, and savings across 72+ sites.
Role
End-to-End Product Designer
Timeline
2024 | 6 weeks
Client
UK Fuel Retail Group
Tools


Problem Statement

Running 70+ forecourts means fuel prices, cash takings, tank stock and supplier costs change constantly sometimes hourly. Despite that pace, the business ran on a patchwork of spreadsheets, phone calls, and standalone tools. Site managers priced fuel by instinct. Area managers chased updates over email. Finance rebuilt the same numbers by hand every month just to post them into Sage.
Questions
Which tool actually owns fuel pricing decisions today?
How do we know a site's cash report is accurate before it reaches the ledger?
Where is money actually being lost - pricing, forecourt shrinkage, or reporting delays?
Has fuel pricing ever been standardized across the network, or does every site do it differently?
Activities
Stakeholder Interviews
Process Mapping
User Flow Design
Admin Dashboard Design
High-Fidelity Prototyping
0+
0+
Forecourt sites unified onto one platform
0+
0+
Distinct user roles designed for
0+
0+
Core workflows consolidated into a single dashboard
0
0
Shared source of truth — replacing scattered spreadsheets
Defining Problem Statement
They didn't need another reporting tool. They needed one place where pricing, cash, and stock data were already correct before it ever reached head office.
Research
I connected with site managers as they updated prices between customers, traced how a cash report moved from forecourt till to head office ledger, and heard where area managers lost trust in the numbers they were given. Four different roles, all depending on the same data just at different speeds and for different reasons.

Site and area teams don't need more data. They need one dashboard where pricing, cash, and savings are already trustworthy the moment they log in.
Opportunity mapping
After mapping how pricing, cash reconciliation, and reporting actually moved through the business, every disconnect became visible. Instead of designing feature by feature, I focused on where operational data was created, verified, and passed on because that's where trust in the numbers either held or broke down.
I organized opportunities around two things:
Operational Frequency — how often teams touch fuel prices and cash data day to day
Financial Impact — how directly each workflow affects margin, savings, or ledger accuracy.
The Final Experience
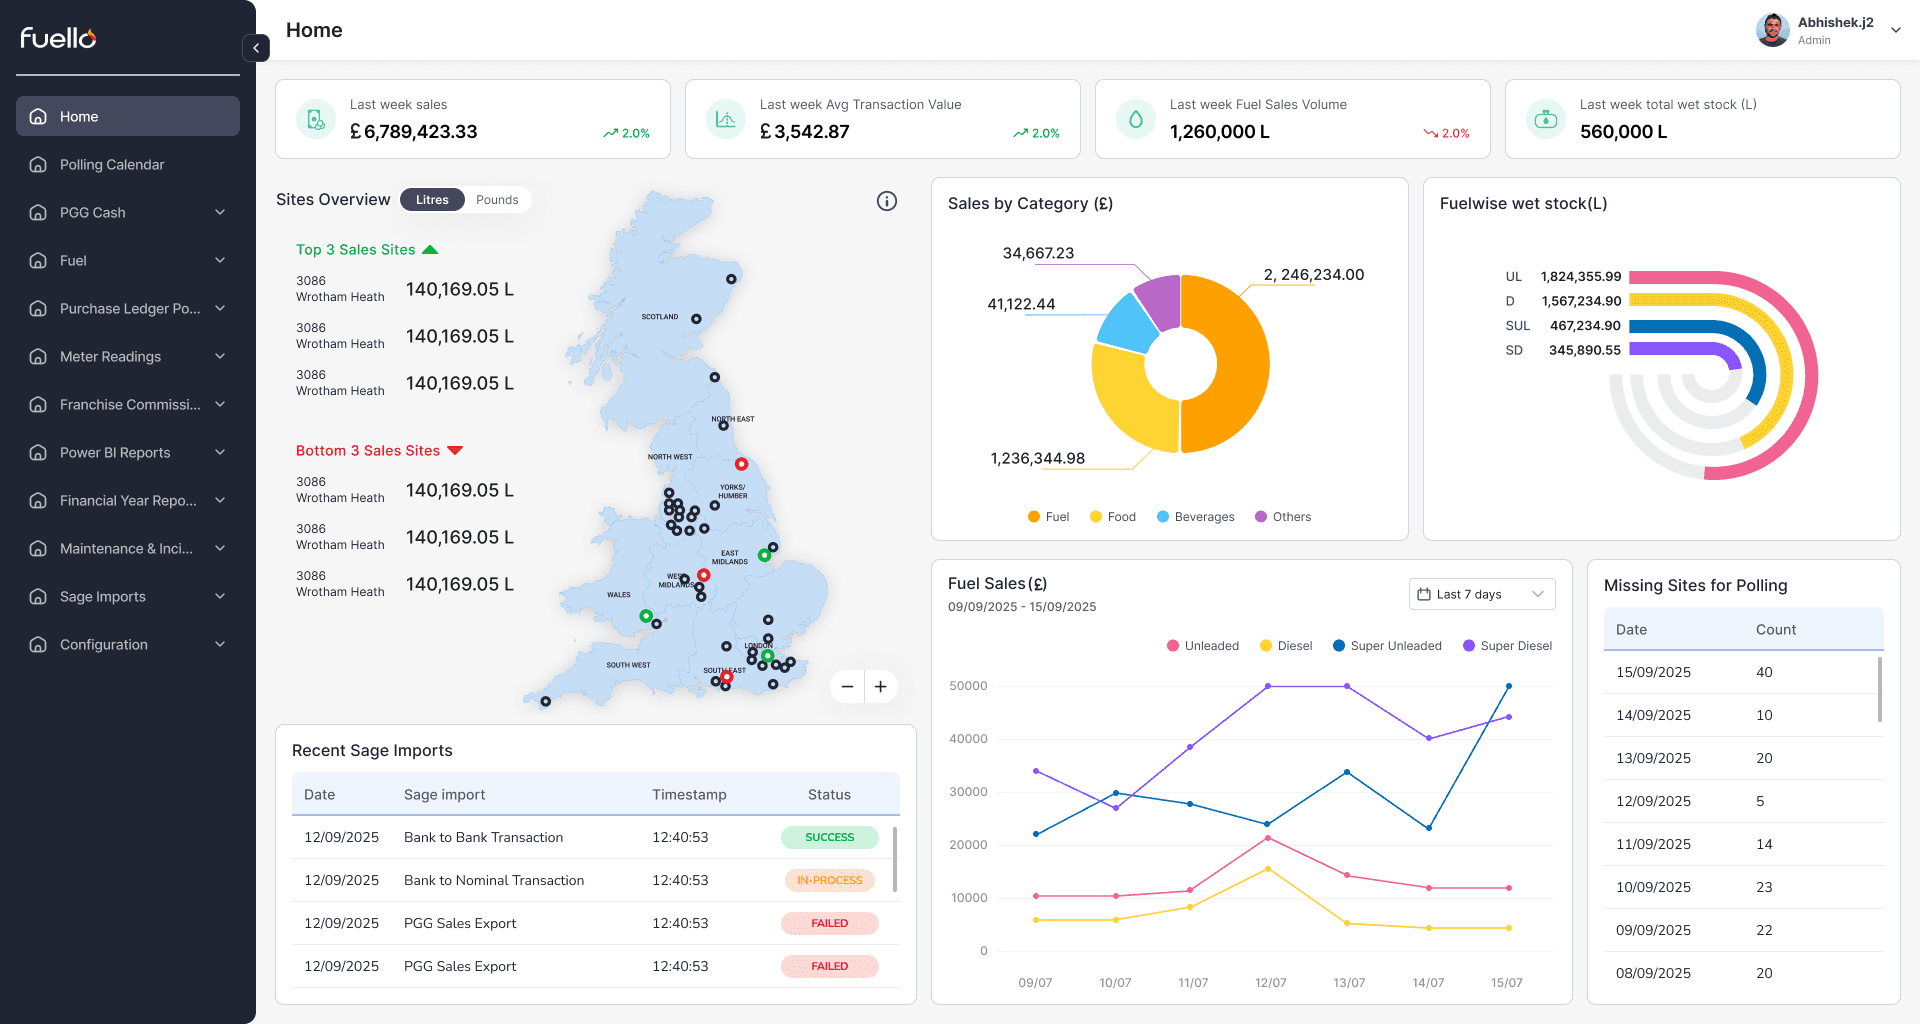
Home

Fuel price

Polling Calendar

Fuel Proce Verification

Role Based Access
Impact Overview

Digitised fuel pricing and cash workflows — Replaced manual, paper- and spreadsheet-based pricing and cash entry with a connected digital dashboard.
Connected site, area, and finance teams — Created a shared view between site managers, area managers, and head office finance instead of siloed reporting.
Increased visibility into sales and savings — Gave every role real-time insight into fuel sales, savings, and forecourt performance.
Reduced manual re-keying — Cash and pricing data now flows toward Sage without being rebuilt by hand each week.
Built for scale — Designed to support 72+ sites today and grow with the network.